

Introduction
Statistics is the bridge between the data you have and the insight you need. The scope ranges from simple summaries and exploratory analyses to complex modeling and hypothesis testing.
Summary Statistics
Summary statistics provide a snapshot of a system without attempting to explain what’s going on behind the scenes or to predict how things might change. Presented as tables or simple plots, these give you an overview of the information contained within your data. Summary statistics are ideal when you simply need to record and report on the data you collected, whether it’s a laboratory experiment or a nationwide survey.
Exploratory Data Analysis
Often a precursor to more detailed statistical analysis and modeling, but still a very valuable exercise. The book begins to explore the relationships between the variables within the data set, to identify patterns and trends that help you understand what’s going on.
Assumptions will be tested to understand what sorts of processes might be involved in generating your data. Sophisticated visualization techniques are used to display complex relationships in an easily-digestible manner to help you communicate the results and understand in simple terms what’s going on.
Statistical Analysis
Statistical analyses range from hypothesis tests to predictive models. They are used to answer specific questions, either about what’s happening now or what might happen in the future. They provide a detailed insight into your data to create clear conclusions and motivate intelligent decisions.
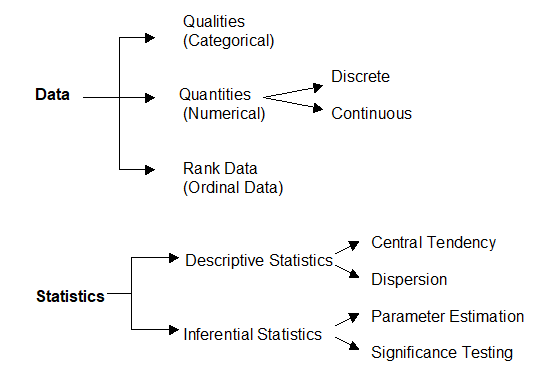
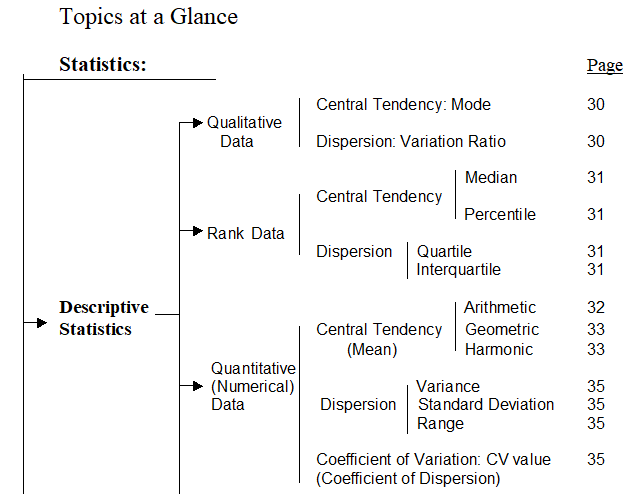
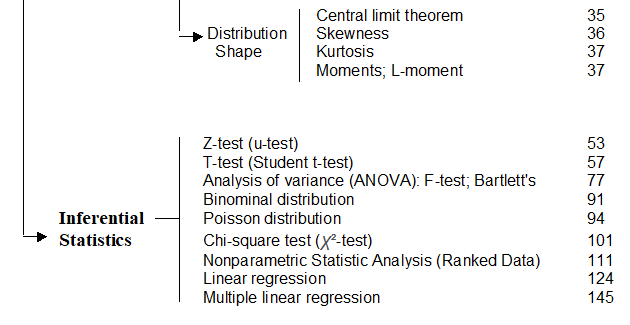
This book is focus on description of data and analysis of data with help you understand and learn exactly what you need to know about statistical ideas and techniques, fundamental formulas and calculations and statistical core topics in scope of applications. The book is mainly based on the following two illustration figures to extend the statistic contents.
For your better and/or easier understanding, this book includes more than forty examples in explanation and/or illustration, step by step, to let you understand or have ideas to understand on how and why the statistic formula and calculation be applied.
It is assumed that you’ve had a basic algebra background and can do some of the basic mathematical operations and understand some of basic notation used in algebra like x, y, summation sign, taking the square root, squaring a number, and so on.
Categories:
Basic concepts:
1. Mean
The arithmetic mean, more commonly known as “the average,” is the sum of a list of numbers divided by the number of items on the list. The mean is useful in determining the overall trend of a data set or providing a rapid snapshot of your data. Another advantage of the mean is that it’s very easy and quick to calculate.
Pitfall:
Taken alone, the mean is a dangerous tool. In some data sets, the mean is also closely related to the mode and the median (two other measurements near the average). However, in a data set with a high number of outliers or a skewed distribution, the mean simply doesn’t provide the accuracy you need for a nuanced decision.
2. Standard Deviation
The standard deviation, often represented with the Greek letter sigma, is the measure of a spread of data around the mean. A high standard deviation signifies that data is spread more widely from the mean, where a low standard deviation signals that more data align with the mean. In a portfolio of data analysis methods, the standard deviation is useful for quickly determining dispersion of data points.
Pitfall:
Just like the mean, the standard deviation is deceptive if taken alone. For example, if the data have a very strange pattern such as a non-normal curve or a large amount of outliers, then the standard deviation won’t give you all the information you need.
3. Regression
Regression models the relationships between dependent and explanatory variables, which are usually charted on a scatterplot. The regression line also designates whether those relationships are strong or weak. Regression is commonly taught in high school or college statistics courses with applications for science or business in determining trends over time.
Pitfall:
Regression is not very nuanced. Sometimes, the outliers on a scatterplot (and the reasons for them) matter significantly. For example, an outlying data point may represent the input from your most critical supplier or your highest selling product. The nature of a regression line, however, tempts you to ignore these outliers. As an illustration, examine a picture of ANSCOMBE’S QUARTET, in which the data sets have the exact same regression line but include widely different data points.
4. Sample Size Determination
When measuring a large data set or population, like a workforce, you don’t always need to collect information from every member of that population – a sample does the job just as well. The trick is to determine the right size for a sample to be accurate. Using proportion and standard deviation methods, you are able to accurately determine the right sample size you need to make your data collection statistically significant.
Pitfall:
When studying a new, untested variable in a population, your proportion equations might need to rely on certain assumptions. However, these assumptions might be completely inaccurate. This error is then passed along to your sample size determination and then onto the rest of your statistical data analysis
5. Hypothesis Testing
Also commonly called t testing, hypothesis testing assesses if a certain premise is actually true for your data set or population. In data analysis and statistics, you consider the result of a hypothesis test statistically significant if the results couldn’t have happened by random chance. Hypothesis tests are used in everything from science and research to business and economic
Pitfall:
To be rigorous, hypothesis tests need to watch out for common errors. For example, the placebo effect occurs when participants falsely expect a certain result and then perceive (or actually attain) that result. Another common error is the Hawthorne effect (or observer effect), which happens when participants skew results because they know they are being studied.